Efficiency GapsPaints inefficient candles ( where candles on both sides of a candle don't meet in the middle. )
Average True Range period and multiplier from 0.01 to 1 can be used to filter out small gaps.
Price is likely to return to these areas and they are possible support / resistance levels.
Combine with volume profile to detect low volume areas.
"volume profile"に関するスクリプトを検索

BE - Pr_DayLowHigh_BreakoutScreener AlgoHerewith presenting the Screener based indicator which supports Algo trade on the NSE stocks. The idea behind this indicator is when the Current day stock breaks out of Yesterday's high or Low with promising volumes (Using MA's and POC of Volume Profile) along with formation of candle Pattern. Initiates the Trade entries.
Note: Indicator is designed to take an entry even before the candle is closed as soon as the entry level is crossed and it shall exit the trade as soon as the SL is hit even before candle is close.
How to Work with this Indicator.
You can map up to 15 Scripts in this indicator. However you may decide if you wish to load all 15 are few of them. if you wish to load only 10, below settings should help you ignore the rest 10 symbols from screening it for setups
Updating Symbol Script.
This is an important part is used for Algo trades. Read the tooltip for better understanding of the format. Acceptable format is Broker Name followed with : and space with Symbol mapping Name followed with / and Instrument token provided by broker if no token alloted for the script then you may keep 0 against symbol name followed with / and Qty in terms of absolute value or in terms of percentage.
Trade and Scan Settings
Symbol List Mapping
For Improvements in Results - Use Events and keep a track of it / use Nudges etc.

RSI Scalping & Swing Signals With AlertsThis RSI indicator shows a green or red ribbon when the smoothed RSI is bullish or bearish. It also includes a long moving average for overall trend confirmation. Wait until the ribbon holds above or below the long moving average and take positions in that direction.
To get an easier to read RSI indicator, I smoothed the RSI out and paired it next to a short term RMA. These two together form the ribbon that will show you early reversals and trend direction. The long moving average is used as an overall trend detector and confirmation for longer term trends.
***HOW TO USE***
Scalping: Enter longs when the ribbon turns green and enter shorts when the ribbon turns red. Exit positions when the ribbon turns the opposite color or crosses the long moving average.
Swing Trading: When the ribbon holds above the long moving average or breaks out and retests it, look for long positions and exit when the ribbon turns red or crosses the long moving average. When the ribbon holds below the long moving average or breaks down and retests it, look for short positions and exit when the ribbon turns green or crosses the long moving average.
***DETAILS***
This indicator gives early reversal signals very well and waiting for the RSI ribbon to cross the long moving average helps to get you into positions when the market is ready to really move while filtering out some of the noise.
The ribbon and background will change to green or red depending on whether it is currently bullish or bearish.
There is also a label that changes colors and tells you if RSI is bullish or bearish and also whether the RSI ribbon is above or below the long moving average.
Green or red circles will appear on the indicator when there is a bullish or bearish cross of the RSI ribbon and the long moving average.
It also has alerts that trigger when RSI is turning bullish/bearish or when the RSI ribbon is crossing the long moving average.
***CUSTOMIZATION***
Each piece of this indicator can be customized to suit your preferences including the RSI source, length, smoothing length, short moving average length and long moving average length. You can also turn off the labels, signals and long moving average. All of these settings can be managed within the indicator settings input tab.
***MARKETS***
This indicator can be used as a signal on all markets, including stocks, crypto, futures and forex.
***TIMEFRAMES***
This RSI Scalping & Swing Signals indicator can be used on all timeframes.
***TIPS***
Try using numerous indicators of ours on your chart so you can instantly see the bullish or bearish trend of multiple indicators in real time without having to analyze the data. Some of our favorites are Trend Friend Scalp & Swing Trade Signals, Volume Spike Scanner, Buy & Sell Pressure Volume Profile, and Momentum Scalper in combination with this RSI indicator. They all have real time Bullish and Bearish labels as well so you can immediately understand each indicator's trend.

Momentum Scalping & Swing Signals With AlertsThis Momentum indicator shows a green or red ribbon when smoothed momentum is bullish or bearish. It also includes a long moving average for overall trend confirmation. Wait until the ribbon holds above or below the long moving average and take positions in that direction.
To get an easier to read momentum indicator, I smoothed the momentum out and paired it next to a short term RMA. These two together form the ribbon that will show you early reversals and trend direction. The long moving average is used as an overall trend detector and confirmation for longer term trends.
***HOW TO USE***
Scalping: Enter longs when the ribbon turns green and enter shorts when the ribbon turns red. Exit positions when the ribbon turns the opposite color or crosses the long moving average.
Swing Trading: When the ribbon holds above the long moving average or breaks out and retests it, look for long positions and exit when the ribbon turns red or crosses the long moving average. When the ribbon holds below the long moving average or breaks down and retests it, look for short positions and exit when the ribbon turns green or crosses the long moving average.
***DETAILS***
This indicator gives early reversal signals very well and waiting for the momentum ribbon to cross the long moving average helps to get you into positions when the market is ready to really move while filtering out some of the noise.
The ribbon and background will change to green or red depending on whether it is currently bullish or bearish.
There is also a label that changes colors and tells you if momentum is bullish or bearish and also whether the momentum ribbon is above or below the long moving average.
Green or red circles will appear on the indicator when there is a bullish or bearish cross of the momentum ribbon and the long moving average.
It includes alerts that trigger when momentum is turning bullish/bearish or when the momentum ribbon is crossing the long moving average.
***CUSTOMIZATION***
Each piece of this indicator can be customized to suit your preferences including the momentum source, length, smoothing length, short moving average length and long moving average length. You can also turn off the labels, signals and long moving average. All of these settings can be managed within the indicator settings input tab.
***MARKETS***
This indicator can be used as a signal on all markets, including stocks, crypto, futures and forex.
***TIMEFRAMES***
This Momentum Scalping & Swing Signals indicator can be used on all timeframes.
***TIPS***
Try using numerous indicators of ours on your chart so you can instantly see the bullish or bearish trend of multiple indicators in real time without having to analyze the data. Some of our favorites are Trend Friend Scalp & Swing Trade Signals, Volume Spike Scanner, Buy & Sell Pressure Volume Profile, and RSI Scalper in combination with this momentum indicator. They all have real time Bullish and Bearish labels as well so you can immediately understand each indicator's trend.

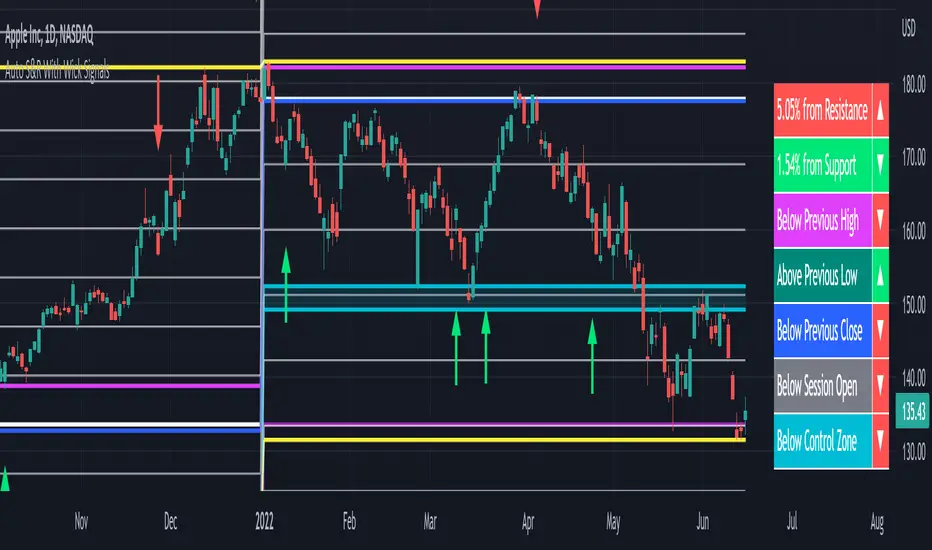
Auto Support & Resistance With Wick Signals & Percentage GapsThis auto support and resistance indicator uses percentage deviations from the previous session close to calculate levels. It provides arrows as signals when it detects 2 wicks in the last 5 bars from a support or resistance level. Includes alerts for price crossing any level as well as real time percentage gaps from current price to the next closest support and resistance level. You also have the option to set up to 3 major levels of your own for any levels that are very important on longer timeframes that you want included. Those will show on the chart as well as within your percentage gap table with color coded background. All features can be customized or turned off to suit your preferences.
SOURCE
This indicator uses the previous session close as a source by default but can be adjusted to use the previous session high or the previous session low. I find the close setting to provide the most accurate levels.
SESSION
The default setting for the previous session used is the daily session but can be adjusted to use the daily, weekly, monthly, quarterly or yearly session. Use longer sessions when looking at longer time frame charts.
SIGNALS
The signals by default are set to only show an arrow if there have been 2 bullish or bearish wicks off of a support or resistance level in the last 5 bars. This can be changed to one bullish wick off of support and one bearish wick off of resistance or it can be set to give a signal anytime a bar crosses a support or resistance level. This can be controlled in the indicator settings.
PERCENTAGE DEVIATION LEVELS
The default percentage deviation is set to 1% but can and should be adjusted according to whatever ticker you are using. For example use .25% or .5% when looking at forex intraday charts since they are not as volatile as other markets. For leveraged etfs used 1% multiplied by the leverage on the etf, so for SQQQ use 3% as it is a 3x leveraged etf. When looking at longer timeframes or highly volatile charts, set the percentage deviation to 2%, 5%, 10%, etc.
LINE COLORS
The color of the lines will change from red to green depending on if the price is above or below that level. You can customize these colors in the settings.
MAJOR LEVELS
If you have major levels of support and resistance from longer timeframes and your own charting, you can add up to 3 major levels that will show on the chart as well as show the percentage gaps in the table. The label for each major level will be colored to match the color of the line on the chart individually.
PERCENTAGE GAP TABLE
The gap table will update live with percentages to go from current price to the next closest support and resistance levels so you don’t have to calculate them manually. The position of the percentage gap table can also be changed within the indicator settings.
TURN FEATURES ON/OFF
There are 3 toggle switches so you can easily turn on or off certain features such as: the support and resistance lines, the percentage gaps table and the arrow signals.
LINE WIDTHS
You can also set the line width of all levels and the line width of the starting level within the indicator settings.
***MARKETS***
This indicator can be used as a signal on all markets, including stocks, crypto, futures and forex.
***TIMEFRAMES***
This automatic support and resistance indicator can be used on all timeframes as long as there is enough data for the session used.
***TIPS***
Try using numerous indicators of ours on your chart so you can instantly see the bullish or bearish trend of multiple indicators in real time without having to analyze the data. Some of our favorites are our Volume Spike Scanner, Volume Profile, Momentum and Trend Friend in combination with this auto support and resistance indicator. They all have real time Bullish and Bearish labels as well so you can immediately understand each indicator's trend.
Single Prints - Session Initial BalancesDisclaimer: Expose yourself to the knowledge of different trading methods. If you are unaware of what a Single Print is then do some research and broaden your knowledge.
This indicator has only been tested on BTCUSDT Binance pair. This indicator is meant to be used on the 30 minute timeframe to highlight Single Prints.
The calculations are base on 0000 UTC and what Single Prints are created during that day.
Single Prints
Single Prints are where prices moves to fast through an area (on a 30 minute timeframe), in the case of this indicator in $50 intervals, where the price has not yet cross back past, represented as orange lines. If you were viewing this on a Time Price Opportunity Chart (TPO) each $50 would be represented as a square with a letter in it. If price has only been through that area once, within that 24 hour period, then it is called a Single Print. If however the Single Print is on the lower wick of the candle it is called a Buying Tail and on the Upper Wick a Selling Tail.
Single Prints leave low volume nodes with liquidity gaps, these inefficient moves tend to get filled, and we can seek trading opportunities once they get filled, or we can also enter before they get filled and use these single prints as targets.
Single Prints are a sign of emotional buying or selling as very little time was spent at those levels and thus there is no value there.
The endpoints of single print sections are considered to be potential support or resistance points and or get filled (like a CME gap).
The above is only a very short summary, to understand Single Prints, Buying Tails and Selling Tails more please do your own research (DYOR).
References:
Trading Riot Volume Profile - Website
TOROS TPO Charts Explained - Youtube
Session Boxes
Session Boxes are the high and low of that markets session before the new market session opens. I used the data from the website Trading Hours for the time input.
White box – Start of day UTC 0000 to Market Close UTC 2000
Purple box – Asia Start UTC 0130 to London Start UTC 0700
Yellow box – London Start UTC 0700 to New York Start UTC 1330
Blue box – New York Start UTC 1330 to Market Close UTC 2000
Red box – Market Close UTC 2000 to End of day UTC 2359
References:
Trading Hours - Website
Initial Balance
The Initial Balance is the market range between the high and low of the first hour of trading for the market. In the case of crypto when is the Initial Balance if it is 24/7.
Context of Initial Balance:
The Initial Balance is traditionally the range of prices transacted in the first hour of trade. Many regard the Initial Balance as a significant range because, especially for the index futures which are tied to the underlying stocks, orders entered overnight or before the open are typically executed prior to the end of the first hour of trade. Some use it to understand how the rest of the day may develop, while others use it as a span of time to avoid trading altogether because of its potential volatility.
For this indicator I have coded the Initial Balance time as below:
White Box - To appear for the first hour of the day 0000 to 0100 UTC .
Purple Box - To appear for the first hour of the day 0130 to 0230 UTC .
Yellow Box - To appear for the first hour of the day 0700 to 0800 UTC .
Blue Box - To appear for the first hour of the day 1330 to 1430 UTC .
Red Box - To appear for the first hour of the day 2000 to 2100 UTC .
The diagram above shows some examples:
How price (white arrows) retraces the single prints.
How price (red arrows) uses the single prints as S/R.
References:
Not Hard Trading – Website
My Pivots Initial Balance - Website
Thanks go to:
StackOverFlow Bjorn Mistiaen
Trading View user mvs1231
Please message me if you have any feedback/questions.
I am looking at developing this indicator further in the future.

Close and Open for Volume Profile AnalysisThis script adds arrows to where Open and/or Close are.
It is usually better to study seasonal volume with candles off, yet it is worth knowing where the closing price is.

PRIME - ShadoW ZoneZ with RSI LevelsIn This experimental study, we've taken RSI data, Volume Profile, and Trend analysis, combining them into one unique package that will allow a trader to analyze market trend lines and their proposed channels, trend momentum through candle color augmentation similar to "Pulse", and Visible Volume index price levels on chart for the current sequence. Below are explanations of each function within the system.
The Semafor is used to spot future multi-level Supports and Resistance zones.
It is also useful to spot HL or LL or HH or LH zones at different Depth settings.
The red zones are the extreme places where the market has a higher chance of reversing while the green zones have the lowest setting with lower chances of the market reversal
Automatic Trend Lines
The indicator takes in 2 timeframes to detect High and Low values from which to draw the trend lines of each timeframe.
As the values change with price movement, the lines are updated. They are color coded for uptrend and downtrend based on the direction of each individual line. Trend lines can be set up to color with only the default value on the configurations panel.
- Toggle on/off Color Coded
- Change Default, Uptrend, Downtrend color
- Change Line Width
- Change Line Style
- Toggle on/off Line Extensions
- Change Extended Line Width
- Change Extended Line Style
- Toggle On/Off labels for 7 data points of each timeframe
Automatic Trend Sights
This is a neat feature that may help you get a better feel for the direction the current movement is heading towards in correlation with the short or medium length timeframe trends. The sight draws a line from the middle vertical point of the trend coordinates towards the current price. They are toggled off by default but can be enabled in the configurations panel.
- Toggle on/off sight on each timeframe
- Change Width
- Change Line Style
Support & Resistance Levels, the main aim of the study. Level calculations are based on Relative Strength Index ( RSI ) threshold levels of oversold/overbought and bull/bear zones, where all threshold values are customizable through the user dialog box. Background of the levels can be colored optionally.
RSI Weighted Colored Bars and/or Mark Overbought/Oversold Bars , Bar colors can be painted to better emphasis RSI values. Darker colors when the oscillator is in oversold/overbought zones, light colors when oscillator readings are below/above the bull/bear zone respectively, and remain unchanged otherwise. Besides the colors, with “Display RSI Overbought/Oversold Price Bars” option little triangle shapes can be plotted on top or bottom of the bars when RSI is in oversold/overbought zones .
Disclaimer:
Trading success is all about following your trading strategy and the indicators should fit within your trading strategy, and not to be traded upon solely
The script is for informational and educational purposes only. Use of the script does not constitute professional and/or financial advice. You alone have the sole responsibility of evaluating the script output and risks associated with the use of the script. In exchange for using the script, you agree not to hold dgtrd TradingView user liable for any possible claim for damages arising from any decision you make based on use of the script

Mean Deviation Detector - Throw Out All Other IndicatorsI set out this morning to create a script that searches out price moves that went too far too fast relative to historical pricing, given that such situations often result in the most profitable trading opportunities. I came up with the mean deviation detector. This script should be used as a means of judging how far a price is trading, in percent terms, from it's "average trading zone".
This is extremely helpful in a couple scenarios.
First, it can be used to judge a move's volatility relative to it's previous volatility. Put simply, a 5% move in the stock of Coca Cola is a lot more meaningful than a 5% move in the stock of Tesla, and the detector puts moves into historical (visual) perspective.
Second, the indicator can be used in real time as a means of determining when the chances of mean reversion are high or low. Extreme values are unsustainable and often lead to EITHER A.) price mean reversion or B.) time mean reversion. Put simply, prices either went too far and are due to fall back to a historical mean, or they need more time to digest a potentially new pricing zone.
Without getting too deep into volume profile analysis, the MDD can be a simple way of telling that a stock has moved into an "air pocket", where prices will either come back to the previous volume node (price mean reversion) or set up shop in a new, uncharted area (time mean reversion).
An extreme value doesn't always mean a trading opportunity, but it means that something interesting is happening in the stock / instrument.
I use this indicator to help me trade covered calls. Lots of high yielding weekly opportunities are stocks that have moved too far too fast, and I like to use this indicator as a means of either a.) scooping up stocks that have gotten beat up from a historical mean perspective & have likely seen the risk already "beaten" out of them, or to b.) stay away from stocks that have a very high chance of price correcting lower. In situations where I say that the risk has been "beaten" out of something, it doesn't mean that the stock won't continue to fall, it simply means that the degree and acceleration of the fall has peaked and that risk premiums in selling options will / should easily pay for continued losses. In the event that it's a price correction and not a time correction, you also increase your bat rate because you get auto-liquidated at a max profit. It's a really valuable tool in my kit.
You can also feel free to put a Keltner Chanel overlay onto the MDD to filter out noise, identify "extreme" values, and place mean reversion trades if you expect price mean reversion is likely, if you want to use this as the basis of a proper trading strategy. For a high extreme value, you could sell short term OTM call spreads, for example.
The MDD is adaptable to your own trading style & preferences.

Hancock - Volume HeatSimple script that shows the volume profile over a moving period as a heat map. Value area is the green area with the white line as the POC.
Happy trading
Hancock

Initial Balance - (IB)Hello Traders,
--->> Initial Balance (IB) which plays a very important role in Day Trading, that can be used as a referance area <<---
This indicator plots the 1 Hr IB high and low area that can be used as a tool for trading decision.
Will be very helpful to the traders who has idea about Volume Profile trading.
Just a note :
If the IB is narrow compared to the prev day then one can expect a breakout, if IB is extended then the day might be oscillating inside the area only.
nothing fancy :)))
cheers,
enjoy
Sanjay Ramanathan


MTF Structure Table Smart Money📊 MTF Structure Table — Smart Money (CHoCH / BOS)
MTF Structure Table is a minimalistic Smart Money Concepts (SMC) tool designed to display real-time market structure across multiple timeframes in a clean, distraction-free format.
The indicator does NOT plot anything on the chart. Instead, it shows a compact table in the corner of the screen with the current structural state:
• CHoCH — Change of Character
• BOS — Break of Structure
🔍 What it shows
• Current Smart Money structure on selected timeframes
• Bullish / Bearish bias via color coding
• Only the latest confirmed structural event per timeframe
⚙️ Flexible settings
• Select timeframes: 5m / 15m / 30m / 1h / 4h / D / W / M
• Enable or disable each table row independently
• Display modes:
– CHoCH + BOS
– CHoCH only
• Adjustable table position and size
🧠 Who it’s for
• Traders using Smart Money Concepts (SMC)
• Multi-timeframe structure analysis without chart clutter
• Fast MTF bias validation before execution
✅ Key advantages
• Zero chart noise — no lines, zones, or signals
• Clear multi-timeframe structure at a glance
• Perfectly complements:
– Order Blocks
– Liquidity levels
– Fair Value Gaps
– Volume Profile
⚠️ Disclaimer
This indicator is NOT a trading strategy and does not generate entry signals.
It is intended to be used as a structural context tool to support decision-making.

DeM Indicator
This script provides an implementation of the DеMаrker (DeM) Oscillator , a classic technical indicator developed by Thomas DеMаrk to identify trend exhaustion and market reversal points.
Unlike the Relative Strength Index (RSI), which primarily uses closing prices, the DеMаrker indicator focuses specifically on intra-period highs and lows to measure buying and selling pressure.
🚀 How It Works
The DеMаrker indicator compares the current period's price extremes to the previous period to isolate demand:
DeMax (Buying Pressure): Calculated when the current high is higher than the previous high.
DeMin (Selling Pressure): Calculated when the current low is lower than the previous low.
Smoothing: Both values are smoothed using a Simple Moving Average (SMA), typically over 14 periods.
The resulting value oscillates between 0 and 1.0 , providing a clear visual of price exhaustion.
💡 Trading Strategies
Overbought/Oversold Reversals:
- Bearish Signal: A reading above 0.70 suggests the market is overbought. Traders often look for the line to cross back below 0.70 to confirm a downward reversal.
- Bullish Signal: A reading below 0.30 suggests the market is oversold. A cross back above 0.30 can signal a potential upward reversal.
Trend Exhaustion: High DеMаrker values during an uptrend often precede a period of consolidation or "price exhaustion."
Divergence: Watch for cases where price makes a new high but the DeM indicator fails to reach a new peak, suggesting weakening momentum.
⚙️ Settings & Customization
DеMаrker Period: The default is set to 14. Shorten for more sensitivity; lengthen to filter out noise.
Visual Thresholds: Levels are set at 0.7 and 0.3. For volatile assets like Crypto, some traders prefer 0.8 and 0.2.
🛠️ Integration
The DеMаrker is most effective when combined with other tools such as Volume Profile, Moving Averages, etc.
Disclaimer: This script is for educational and analytical purposes only. Past performance does not guarantee future results. Always manage your risk according to your personal trading plan.

Initial Balance Trader NXiIB (Initial Balance) can be trade at IBL or IBH. My setup based on 30min IB zone. This strategy can be trade in GOLD, SP500 or Currencies etc. Can be combine with VP (Volume profile)
Visit us for more:
www.traderxi.com

VIP ALERTS - Risk Management SuiteVIP ALERTS - Risk Management Suite
1) Volume Profile
2) Key Levels
3) Trend + MA Suite
4) Buy/Sell Alert
5) Scalping Alert

DFH - Zenith Resonance - Market Phase Intelligence (ZMR)DFH - Zenith Resonance - Market Phase Intelligence (ZMR) is an institutional-grade analytical framework designed to identify capital-driven market behavior through multi-factor, multi-timeframe analysis.
Unlike traditional indicators that rely on single oscillators or isolated thresholds, ZMR integrates multiple signal families—including momentum, structure, volatility, and market participation—across various timeframes to help traders identify:
• Institutional accumulation phases
• Impulse expansion (momentum surges)
• Climax and exhaustion patterns
• Distribution and breakdown phases
ZMR is not a buy/sell signal generator.
It is a market phase intelligence framework.
Core Philosophy: Structure vs. Energy
Resonance, Not Single Signals
ZMR analyzes market behavior across two complementary dimensions:
Structure (Context):
• Defines equilibrium zones, trend control, and key decision levels
• Slower-moving components with higher reliability
• Answers: "Where are we in the bigger picture?"
Energy (Impulse):
• Detects acceleration, imbalance, and capital deployment
• Faster-moving components for timing precision
• Answers: "When is intent turning into action?"
Structure tells you WHERE.
Energy tells you WHEN.
When both dimensions align—creating resonance—market noise decreases and analytical clarity increases.
Key Features
✓ Multi-timeframe phase detection
✓ Adaptive signal generation across market conditions
✓ Visual phase identification through color-coded backgrounds
✓ Institutional accumulation and distribution detection
ZMR works best when combined with price action analysis, volume profile, and proper risk management.
Educational Use
This indicator is designed for educational and analytical purposes. It helps traders:
• Understand multi-timeframe market structure
• Recognize institutional behavior patterns
• Improve timing precision through resonance concepts
• Develop context-aware trading strategies
Access & Support
This is an invite-only indicator.
To request access or learn more about ZMR methodology:
• Send a direct message through TradingView
Trial periods and educational resources are available for qualified traders.
Risk Disclaimer
IMPORTANT:
• ZMR does NOT provide financial advice or guaranteed trading signals
• This tool provides market phase intelligence to support your independent decision-making
• Past performance and backtested results do not guarantee future performance
• Trading involves substantial risk of loss and is not suitable for all investors
• You are solely responsible for your trading decisions and risk management
• Always conduct your own analysis and consult with qualified financial professionals before making investment decisions
• No indicator can predict market movements with certainty
By using this indicator, you acknowledge that all trading decisions and their consequences are your own responsibility.

Daily 50 per cent (High Low Dinamic)📊 Daily 50% Mid – Dynamic High/Low
🔎 Description
The Daily 50% Mid is a clean and objective indicator that plots the daily equilibrium level, calculated as 50% of the distance between the daily high and daily low.
Unlike static levels, this indicator is fully dynamic: as new daily highs or lows are formed, the 50% level is recalculated in real time throughout the trading session.
⚙️ How it works
Automatically detects:
📈 Daily High
📉 Daily Low
Calculates the daily midpoint:
(
𝐷
𝑎
𝑖
𝑙
𝑦
𝐻
𝑖
𝑔
ℎ
+
𝐷
𝑎
𝑖
𝑙
𝑦
𝐿
𝑜
𝑤
)
/
2
(Daily High+Daily Low)/2
Continuously updates the levels while the trading day is in progress.
📐 What the indicator plots
🔴 Daily High line
🟢 Daily Low line
🟡 50% of the Daily Range (Daily Mid) line
🎯 Trading applications
The 50% daily midpoint is widely used as:
A daily balance / equilibrium zone
A pullback level in trending days
A rejection area in range-bound markets
A confluence level with:
VWAP
Daily open
Volume Profile
Price structure
⏱️ Recommended timeframes
Designed for intraday charts
(1m, 5m, 15m, etc.)
Ideal for day trading
Not recommended for daily charts
🧠 Notes
Works on any asset (indices, stocks, forex, crypto)
Automatically resets at the start of each trading day
No future repainting

USDJPY Timing Composite (5-Component)Overview
A sophisticated multi-component oscillator designed specifically for intraday USDJPY trading. This indicator combines five key market drivers to provide high-probability timing signals by isolating true USD strength and JPY weakness from noise.
Components & Methodology
The indicator uses z-score normalization (default 20-period lookback) to make five distinct market signals comparable and combines them into a single composite reading:
Primary USD Strength Signals (60%):
-EURUSD (30%) - Inverted EUR/USD measures USD strength against the Euro
USDCHF (30%) - USD strength against the Swiss Franc
Yield Differential (25%):
US02Y (25%) - 2-Year Treasury yield captures Fed policy expectations and carry trade dynamics
JPY Weakness Confirmation (15%):
CHFJPY (7.5%) - CHF/JPY cross isolates JPY-specific weakness
EURJPY (7.5%) - EUR/JPY cross provides additional JPY context
Key Features
✅ Multi-Source Validation - Separates real USD strength from currency-specific noise
✅ JPY Context Filter - Confirms whether moves are driven by USD strength, JPY weakness, or both
✅ Alignment Indicator - Visual dots show when 4+ components agree (high-confidence setups)
✅ Mean-Reversion Zones - Overbought/oversold thresholds at ±1.5 standard deviations
✅ Clean Visualization - Candle-based display (no wicks) for easy interpretation
How to Use
Basic Signals:
Green candles = Bullish USDJPY pressure (USD strengthening / JPY weakening)
Red candles = Bearish USDJPY pressure (USD weakening / JPY strengthening)
Above +1.5 = Overbought zone → look for mean-reversion shorts
Below -1.5 = Oversold zone → look for mean-reversion longs
High-Confidence Setups (Alignment Dots):
Lime dot at top = 4+ components bullish → strong long bias
Magenta dot at bottom = 4+ components bearish → strong short bias
No dots = Mixed signals → reduce position size or wait for clarity
Divergence Trading:
USDJPY makes new high but composite doesn't confirm → potential reversal down
USDJPY makes new low but composite doesn't confirm → potential reversal up
Best Practices
Timeframes: 5-minute to 15-minute charts for intraday trading
Session Focus: London and New York overlap (peak liquidity)
Pair With: Support/resistance levels, volume profile, or session highs/lows
Risk Management: Use alignment indicator to size positions (larger size when dots present)
Weight Adjustments:
Fed data days (CPI, NFP, FOMC): Increase US02Y weight to 30-35%
Pure FX sessions: Increase -EURUSD/USDCHF weights to 35% each
Risk-off events: Monitor CHFJPY/EURJPY for safe-haven JPY flows
Technical Details
Calculation Method: Z-score normalization with configurable lookback period
Default Weights: -EURUSD 30% | USDCHF 30% | US02Y 25% | CHFJPY 7.5% | EURJPY 7.5%
Extreme Threshold: ±1.5 standard deviations (adjustable)
Alignment Trigger: 4 out of 5 components in agreement
Customizable Parameters:
Z-score lookback period (default: 20)
Individual component weights
Extreme threshold levels
Alignment indicator on/off
Advantages Over Simple Indicators
Unlike single-pair or DXY-based indicators, this composite:
Filters false signals - USD strength confirmed by two independent FX pairs
Identifies source of moves - Separates USD dynamics from JPY-specific flows
Reduces noise - JPY crosses prevent misreading EUR/CHF weakness as USD strength
Adapts to regimes - Adjustable weights for different market conditions
Suggested Complementary Analysis
Price action at key technical levels
Session opening ranges
Economic calendar (especially Fed events)
Correlation with US equity markets during risk-off periods
Intermarket analysis with JGB yields for JPY policy context
Disclaimer
This indicator is a technical analysis tool and does not guarantee profitable trades. Always use proper risk management, consider fundamental factors, and backtest any strategy before live trading. Past performance does not indicate future results.

Institutional Top-Bottom by Herman Sangivera (Papua)Institutional Top-Bottom + Volume Profile by Herman Sangivera ( Papua )
📈 Component Description
Orange Line (POC - Point of Control): This represents the "Fair Value." Institutions view prices far above this line as "Expensive" (Premium) and prices below as "Cheap" (Discount).
Green/Red Boxes (Order Blocks): These are footprints left by big banks. A Green Box is a demand zone where institutional buying occurred, and a Red Box is a supply zone where institutional selling happened.
Institutional Labels: These appear when the RSI Divergence confirms that price momentum is fading, signaling a high-probability reversal (Top or Bottom).
🚀 Trading Strategy Guide
1. The High-Probability Buy Setup (Bottom)
Look for a "Confluence" of these three factors:
Location: Price is trading below the Orange POC line (Discount zone).
The Zone: Price enters or touches a Green Order Block.
The Signal: The "INSTITUTIONAL BUY" label appears.
Entry: Enter Buy at the close of the candle with the label.
Stop Loss: Place it just below the Green Order Block.
Take Profit: Target the Orange POC line or the nearest Red Order Block.
2. The High-Probability Sell Setup (Top)
Look for a "Confluence" of these three factors:
Location: Price is trading above the Orange POC line (Premium zone).
The Zone: Price enters or touches a Red Order Block.
The Signal: The "INSTITUTIONAL SELL" label appears.
Entry: Enter Sell at the close of the candle with the label.
Stop Loss: Place it just above the Red Order Block.
Take Profit: Target the Orange POC line or the nearest Green Order Block.
💡 Pro Tips for Accuracy
Timeframes: For the best results, use 15m for Scalping, and 1H or 4H for Day/Swing Trading.
Wait for the Candle Close: Labels are based on Pivot points. Always wait for the current candle to close to ensure the signal is locked and won't "repaint."
Avoid Flat Markets: This indicator works best when there is volatility. Avoid using it during "choppy" or sideways markets with very low volume.

Asian Liquidity Sweep + NY Reversal [NY Only]Asian Liquidity Sweep + NY Reversal
Concept
Asia builds a tight range → liquidity pool
London / early NY raids that liquidity (stop hunt)
New York delivers the real move in the opposite direction
Sessions utc+3
Asia range: 04:00 – 10:00
Liquidity sweep: London open → pre-NY (≈10:00–14:00)
Execution window: NY Kill Zone 15:00 – 18:00
Step-by-Step Model
Define Asia Range
Mark:
Asia High
Asia Low
Liquidity Sweep (Stop Hunt)
Price must do ONE of the following:
Sweep above Asia High → bullish liquidity taken
Sweep below Asia Low → bearish liquidity taken
NY Reversal Confirmation (Key Part)
Wait for NY Kill Zone and look for:
Strong rejection candle
Displacement / impulsive move back inside range
Optional: small internal structure break on lower TF
Entry Rules (High Probability)
🔻 If Asia High is swept:
Bias: SELL
Entry:
After NY rejection
On pullback to:
Discount zone / FVG
OR Asia High retest
SL: Above sweep high
TP:
Asia Low (TP1)
NY session low / next HTF liquidity (TP2)
If Asia Low is swept:
Bias: BUY
Entry:
NY rejection + displacement
Pullback to imbalance / Asia Low
SL: Below sweep low
TP:
Asia High
Daily high / premium liquidity
arrows/labels-will show when to buy or sell
signal-once per day
Use volume profile (max) for confirmation of entry point
Lets win together

Smart Money Zones [SMZ] - Automatic Supply & Demand DetectionSmart Money Zones automatically detects and draws institutional supply and demand levels on any timeframe, any ticker.
HOW IT WORKS
The indicator identifies "impulse moves" — strong directional candles that indicate institutional buying or selling. It then marks the consolidation area (base) before the impulse as a key zone where price is likely to react on a retest. Data sources for 'moves' are dark pool block trades and tick data.
• Demand Zones (Green): Areas where buying pressure drove price up sharply. Expect support on retest.
• Supply Zones (Red): Areas where selling pressure drove price down sharply. Expect resistance on retest.
• Confluence Zones (Orange): Where supply meets demand — high-probability reaction areas.
FEATURES
✓ Works on any timeframe (1m to Monthly)
✓ Works on any market (Stocks, Crypto, Forex, Futures)
✓ Auto-merges overlapping zones into single clean levels
✓ Zone strength indicator (thicker lines = more confluence)
✓ Fresh/Tested/Broken status tracking
✓ Configurable alerts for zone entries and breaks
✓ Clean, non-cluttered display
ZONE STATUS
• Fresh: Zone has never been tested — highest probability
• Tested: Price touched the zone but held — still valid
• Broken: Price closed through the zone — invalidated (shown as dotted line)
SETTINGS GUIDE
• ATR Multiplier: Higher = fewer but stronger zones (default 1.5)
• Merge Threshold: Higher = more aggressive zone merging (default 0.3)
• Max Active Zones: Limit displayed zones to reduce clutter
BEST PRACTICES
1. Look for confluence zones (orange) for highest probability trades
2. Fresh zones have higher success rates than tested zones
3. Use higher timeframe zones for stronger levels
4. Combine with your existing strategy for entries
Works great alongside order flow, volume profile, or price action strategies.
```
---
### Features
| Feature | Description |
|---------|-------------|
| Auto-Detection | Finds supply/demand zones without manual drawing |
| Smart Merging | Combines nearby zones into single levels |
| Confluence Zones | Highlights where supply meets demand |
| Multi-Timeframe | Works on any timeframe from 1m to Monthly |
| Universal | Stocks, Crypto, Forex, Futures, Indices |
| Zone Strength | Thicker lines indicate stronger confluence |
| Status Tracking | Fresh → Tested → Broken lifecycle |
| Alerts | Get notified on zone entries and breaks |
---
### Settings
| Setting | Default | Description |
|---------|---------|-------------|
| ATR Period | 14 | Period for volatility calculation |
| ATR Multiplier | 1.5 | Impulse detection sensitivity (higher = fewer zones) |
| Merge Threshold | 0.3 | Zone merging distance in ATR units |
| Max Active Zones | 15 | Maximum zones per type (demand/supply) |
| Show Labels | On | Display zone type labels |
| Show Broken Zones | Off | Keep or hide invalidated zones |
| Show Strength | On | Thicker lines for stronger zones |
---
### How It Works
1. **Impulse Detection**: Identifies candles with body size > ATR × multiplier
2. **Base Finding**: Looks back to find consolidation candles before the impulse
3. **Zone Creation**: Draws horizontal line at the key level (top of demand, bottom of supply)
4. **Merging**: Combines zones within the merge threshold distance
5. **Status Tracking**: Updates zone status as price interacts with levels
---
### Keywords
`supply demand` `support resistance` `smart money` `institutional levels` `order blocks` `liquidity zones` `automatic zones` `key levels` `reversal zones` `price action`

the best script out for the painThis script gives you volume profile, fibanocci, trading signals, and more. highlighting value areas and giving you multiple timeframe trend directions. this indicator is the best one i have made so far
